
This is a working finance formula cheat sheet — the core financial-management ratios, dividend-valuation models, and capital-budgeting rules on one page, in plain terms for Philippine business owners and finance students. Use the contents below to jump to what you need.
Table of Contents
Role of Financial Manager
Financial Analysis
Quality of Earnings
Financial Planning
Working Capital Management
Cash Management
Capital Budgeting
Corporate Financing
Role Of Financial Manager
- Monitor financial health and threats thereof -Financial analysis and forecasting
- Guide/direct the company’s investment decisions – Capital budgeting and working capital policy/management
- Direct the company’s financing decisions – Capital structure, debt policy, dividend policy
Financial Analysis
The objective is to assess:
Profitability
- Return on investment
- Return on investment
- Efficiency
- Cost control
- Shareholder value analysis
Risk
- Market risk
- Financial risk & flexibility
- Leverage
- Solvency
- Liquidity
- Quality of earnings
Value of Financial Analysis Ratio Analysis
- Evaluation of past performance
- To assess a firm’s current financial position, condition and performance
- Gain insights useful for projecting future results
- Microeconomic relationships within a company
- A company’s financial flexibility, the ability to obtain cash to grow the business, ability to pay obligations, etc.
- Management’s capability
- 4. It is of interest to shareholders, creditors, regulators, and the firm’s own management
- 5. Ratios can “standardize” F/S information and make it possible to compare companies of varying sizes
Ratios are not the end-game answers. Ratios are just the starting point and indicate where to conduct further investigation. Anyone can crunch the numbers and generate the ratio. The real skill is putting life into the numbers
Calculate ratios and compare them with:
- Planned ratio for the period
- Ratio during preceding period
- Ratio for a similar firm
- Average ratio for other firms in the industry
Limitations
- Companies may have divisions operating in many different industries, which can make it difficult to find comparable industry ratios at the parent company level
- Some ratios might indicate conflicting signal
- The need to use human judgment
- The use of alternative accounting methods
Issues
Earnings quality issues
- Timing of revenue recognition
- Establishment of reserves for losses
- Amortization process for intangible assets
- “Big bath accounting”
- Recurring vs. Non-recurring Earnings
Balance Sheet issues
- Off balance sheet financing
- Problems Caused by Inflation
- “Inventory profit” as a result of the timing of price increases
- Choice of inventory valuation methods a. Last-in, First-out (LIFO) (allowed by US GAAP)
- First-in, First-out (FIFO)
- Weighted Average (WAVE)
- 5. Rising interest rates causing a decline in the value of long-term debt
- 6. Revenues and expenses appear higher compared to previous periods
Financial Ratios


The ratios in these slides, as text
The images above are the quick-reference version. Here are the same formulas as text you can copy, with a one-line read on each. For a small business, most of these can be run straight off your bookkeeper’s trial balance once a quarter.
Profitability Ratios (1 of 2) — return on the money invested. Higher is better on all four.
| Ratio | Formula | What it tells you |
|---|---|---|
| ROA (Return on Assets) | Operating Income / Ave. Total Assets | How hard your total assets work to earn operating profit. |
| ROE (Return on Equity) | Net Income / Ave. Shareholders’ Equity | Return earned on the owners’ money in the business. |
| Return on Common Equity | (Net Income – Preferred Dividends) / Ave. Common Equity | ROE seen by ordinary owners after preferred holders are paid. |
| EPS (Earnings per Share) | Net Income / Wtd. Ave. Common Shares Outstanding | Profit attributable to one share. |
Profitability Ratios (2 of 2) — margins. Higher is better on the first three; lower is better on the operating cost ratio.
| Ratio | Formula | What it tells you |
|---|---|---|
| Gross Profit Margin | Gross Profit / Sales | What’s left of each sales peso after cost of goods sold. |
| Operating Profit Margin | Operating Income / Sales | Profit per sales peso after running the operation. |
| Net Profit Margin | Net Income / Sales | The bottom-line peso kept per peso sold. |
| Operating Cost Ratio | Marketing & Admin Expenses / Sales | Overhead burn per sales peso — you want this going down. |
Cash Flow Ratios (1 of 2) — profit you can actually bank. Higher is better on all four. Operating CF is cash from operations, not accounting profit.
| Ratio | Formula | What it tells you |
|---|---|---|
| CF to Revenue | Operating CF / Net Revenue | How much of your sales converts to operating cash. |
| Cash ROA | Operating CF / Average Total Assets | Cash-based version of return on assets. |
| Cash ROE | Operating CF / Average Shareholders’ Equity | Cash-based version of return on equity. |
| Cash to Income | Operating CF / Operating Income | Whether reported profit is backed by real cash. |
Cash Flow Ratios (2 of 2) — where the operating cash goes. Higher is better.
| Ratio | Formula | What it tells you |
|---|---|---|
| Reinvestment | Operating CF / Cash Paid for Long-term Assets | How well operations fund your own expansion. |
| Cash Dividend Payment | Operating CF / Cash Dividends Paid | How comfortably operating cash covers payouts to owners. |
| Investing and Financing | Operating CF / (Investing Cash Out + Financing Cash Out) | Whether operations cover both investing and financing outflows. |
Coverage Ratios — can you service your debt? Higher is better on all four.
| Ratio | Formula | What it tells you |
|---|---|---|
| Interest Coverage (earnings) | EBIT / Interest Expense | How many times earnings cover the interest bill. |
| Interest Coverage (cash) | (Operating CF + Interest Paid + Taxes Paid) / Interest Paid | The same test, on a cash basis. |
| Debt Coverage | Operating CF / Total Liabilities | Share of total debt operating cash could retire in a year. |
| Debt Payment | Operating CF / Cash Paid for Long-term Debt Repayment | How comfortably cash covers scheduled principal repayment. |
Solvency Ratios — how much of the business runs on borrowed money. Lower is better on the first three. The slide’s note: for “Total Liabilities” it is cleanest to use interest-bearing short-term debt plus interest-bearing long-term debt. For an MSME, this is the plain question of how much of the shop is the bank’s and how much is yours.
| Ratio | Formula | What it tells you |
|---|---|---|
| Debt-to-Asset Ratio | Total Liabilities / Total Assets | Share of assets funded by debt. |
| Debt-to-Capital Ratio | Total Liabilities / (Total Liabilities + Total Equity) | Debt as a share of total capital. |
| Debt-to-Equity Ratio | Total Liabilities / Total Equity | Peso of debt per peso of owners’ money. |
| Financial Leverage Ratio | Total Assets / Total Equity | How far owners’ equity is levered up by borrowing. |
Liquidity Ratios — can you pay what’s due now? Higher is better. The defensive interval is the most useful one for a small operation: it counts how many days you could keep paying if sales stopped tomorrow.
| Ratio | Formula | What it tells you |
|---|---|---|
| Current Ratio | Current Assets / Current Liabilities | Short-term assets against short-term bills. |
| Quick Ratio | (Cash + Marketable Securities + A/R) / Current Liabilities | Same test, excluding inventory. |
| Cash Ratio | (Cash + Marketable Securities) / Current Liabilities | The strictest test — cash and near-cash only. |
| Defensive Interval Ratio | (Cash + Marketable Securities + A/R) / Daily Cash Expenditures | Days of expenses your liquid assets could cover with no new sales. |
Operating Efficiency Ratios (1 of 3) — how hard your assets work to generate sales. Higher is better.
| Ratio | Formula | What it tells you |
|---|---|---|
| Fixed Asset Turnover | Sales / Ave. Fixed Assets | Sales generated per peso of fixed assets. |
| Equity Turnover | Net Sales / Ave. Equity | Sales generated per peso of owners’ money. |
| Total Asset Turnover | Sales / Ave. Total Assets | Sales generated per peso of all assets. |
| Working Capital Turnover | Sales / Ave. Working Capital | Sales supported per peso of working capital. |
| Working Capital | Current Assets – Current Liabilities | The cash cushion funding day-to-day trading. |
Operating Efficiency Ratios (2 of 3) — how fast stock and receivables move. Turnovers: higher is better. Day-counts: lower is better. (Day counts here use a 365-day year.)
| Ratio | Formula | What it tells you |
|---|---|---|
| Inventory Turnover | Cost of Goods Sold / Ave. Inventories | How many times you sell through stock in a year. |
| Days Inventory | 365 days / Inventory Turnover | Days stock sits on the shelf before selling. |
| A/R Turnover | Credit Sales / Average A/R | How many times receivables are collected in a year. |
| Ave. Collection Period | 365 days / A/R Turnover | Days it takes to collect after a credit sale. |
Operating Efficiency Ratios (3 of 3) — supplier terms and the cash cycle. A/P turnover: the slide’s note says you may use Purchases instead of Cost of Goods Sold in the numerator.
| Measure | Formula | What it tells you |
|---|---|---|
| A/P Turnover | Cost of Goods Sold / Ave. A/P | How many times you pay off suppliers in a year. |
| Ave. Payment Period | 365 days / A/P Turnover | Days you take to pay suppliers. |
| Operating Cycle | Days Inventory + Ave. Collection Period | Days from buying stock to collecting the cash. |
| Cash Conversion Cycle | Days Inventory + Ave. Collection Period – Ave. Payment Period | Days your own cash is tied up after supplier credit is used. |
The cash conversion cycle is the number that quietly runs a small retailer. Buy stock on 30-day supplier terms, sell it in 20 days, collect on the spot, and your cash cycle is negative — the supplier is financing your shelves. Sell slowly or extend credit to customers, and the cycle stretches until you are the one funding everyone else.
Time-series analysis (Horizontal Analysis) – Sometimes called the trend analysis, this is a comparative financial statement over a given period
- Use a base year
- Year to year changes
Cross-section analysis (Vertical – Analysis) Sometimes called the common size balance sheet, cash flow and income statement, this technique is about comparing a given firm’s ratios with those of other firms for a specific period.
Common size Balance Sheet:
- All items as a % of Total Assets
- Total Assets = 100%
Common size Income Statement
- All items as a % of Total Revenues
- Total Revenues = 100%
Common size Statement of Cash Flows:
- All items as a % of Total Revenues
- All cash inflow as a % of total inflows AND all cash outflows as a % of total outflows
Quality of Earnings
Quality of earnings emphasizes the degree of reliability of information about economic values as communicated by reported earnings
How to show High quality earnings
- Convert to cash
- Derived from recurring transactions related to the basic business of the company
- Stable, predictable, and indicative of future earnings levels
- Consistent, conservative accounting policies that result in prudent measurement
Financial Planning
- Forecast sales
- Prepare forecast income statement (e.g. using a percentage of sales method)
- Prepare a forecast balance sheet. Identify assets and liabilities that “spontaneously” increase or decrease with sales.
- Compute Additional Funds Needed (AFN)
- Determine the financing plan.
- Feedback costs of financing plan in the forecast income statement.

The diagram reads top-down: goals and objectives set the direction, strategy formulation decides how to get there, operations planning and programming turns that into activity, and financial planning and forecasting puts numbers on all of it. Financial planning is the last step, not the first — the money plan follows the business plan. For an MSME, that order matters: work out what you intend to sell and how before you forecast the peso figures, or the forecast just measures a plan you never made.
AFN Formula: Required Increase in Assets – Spontaneous Increase in Liabilities – Increase in Retained Earnings
Factors affecting AFN
AFN = f(sales growth, capital intensity*, payout ratio, spontaneous liabilities-to-sales ratio, profit margin)
*Capital intensity = ratio of assets required per sales peso
- Assumptions in the Usage of the Percentage of Sales Method
- Constant Ratios
- Identical Growth Rates
- Be alert on situations where assumptions do not hold o Economies of Scale o Lumpy Assets
- Disproportionate growth rates
Working Capital Management
A managerial accounting strategy focusing on maintaining efficient levels of both components of working capital, current assets, and current liabilities, in respect to each other. Working capital management ensures a company has sufficient cash flow in order to meet its short-term debt obligations and operating expenses.
Cash Conversion Cycle = Days Receivables + Days Inventory – Days Payable
Days Inventory = 365 / Inventory Turnover Ratio (COGS/Ave Inventory)
Indicates the length of the period between the purchase and the sale of inventory during each operating cycle
Days Receivable = 365 / AR Turnover Ratio (Sales/Ave Receivables)
Indicates the length of the period between the sale of inventory and the collection of cash from customers during each operating cycle
Days Payable = 365 / AP Turnover Ratio*
Indicates the length of the period between the purchase of inventory on the account and the payment of cash to suppliers during each operating cycle
*AP Turnover Ratio = Purchases on Account / Average AP
NE Cycle = DI + DR – DP
Operating Cycle = DI + DR
WC Management and Policy
Working capital policy comes down to two decisions. The first is the investment and financing decision — how much to tie up in receivables, inventory and cash, and how to fund it. The second is the trade-off between profitability and risk: hold more current assets and you sleep easier but earn less on money left idle; run lean and you squeeze out more return but flirt with coming up short when a payment falls due.
Working capital has a handful of moving parts, and each one has its own lever. Here is how to think about them.
Cash. Keep a minimum cash balance sized to how steady your inflows and outflows are — a business with lumpy, unpredictable collections needs a bigger cushion than one paid like clockwork. Two things pull that cushion down. When interest rates are high, idle cash is expensive to hold, so keep the balance lean. And the more credit lines you have standing by, the less cash you need to park, because the credit line is your backup.
Accounts receivable. This is the money customers owe you, and how you manage it decides how much of your sales actually turns into cash. Accepting credit cards carries no credit risk to you — the card company wears that — but it costs more and the money lands in your account with some delay. When you extend your own credit, screen it against these criteria:
- Terms — how long the customer has to pay.
- Installment — whether the balance can be paid in parts.
- Interest for delayed or late payment.
- Discounts for prompt payment, to pull cash in faster.
- Who gets credit and who is refused — screen the customer’s information before you extend it.
- Limit — the ceiling on how much any one customer can owe at a time.
- Collection system — the channels you will actually get paid through, such as bank, internet transfer, or bayad centers.
Two forces tighten this up. When interest rates are high, be less generous with credit — every peso stuck in receivables is a peso you are financing at a higher cost. And your terms are not set in a vacuum; competitive pressure and your own operating costs push them around too.
Inventories. Same logic as cash. When interest rates are high, carry lower inventory — stock sitting on the shelf is money you have borrowed and are paying to hold. Keep everything lean.
Accounts payable. This is the money you owe suppliers, and it is quietly one of the cheapest forms of financing you have. Trade credit is not just the act of buying — it is financing you can arrange simply by buying on account. Its cost is the discount you give up by not paying early. Read a term like 3/10 net 30 this way: you have 30 days after the sale to pay, but if you pay within 10 days you get a 3% discount on the amount due. Skip that discount and the 3% is what the extra 20 days of credit cost you. You can usually stretch payables and delay payment a little, but take care not to strain the supplier relationship — the goodwill is worth more than a few days of float.
Short-term loans. These are for meeting seasonal requirements — the extra stock you carry before a peak season, the payroll you cover while waiting on collections — not for funding long-term growth. A credit line carries two costs worth naming: a commitment fee, which you pay just to keep the line open even if you never draw on it, and a compensating balance, a minimum you must keep sitting in the account. A revolving credit line lets you borrow and repay as you are able, up to an agreed limit, so it flexes with your cash cycle.
Other Important Things to Observe:
- Growth – usually requires long-term financing
- Seasonality – normally addressed through short-term financing
- Inefficiencies – eliminate (check through Inv TO & A/R TO measures)
Cash Management
Cash management starts with a cash budget — a detailed forecast of your cash inflows and outflows over a set period. It answers the question every owner asks: how much cash should the business actually hold? Two things shape the answer. There are holding and ordering costs for cash — hold too much and you give up the return it could have earned, hold too little and you pay the cost and hassle of scrambling to raise more. And there is float — the timing gap between when a payment is written and when it actually clears, which can work for you or against you.
To build the forecast, list where the cash comes in and where it goes out. On the inflow side, the main sources are collections on receivables and collections from your other revenue streams. On the outflow side, the big ones are salaries and wages, rent and other overheads, and payments for purchases. Line these up period by period and you can see a shortfall coming before it arrives — which is the whole point of the exercise.

Two classic cash-management models. The Baumol model (left) treats cash like inventory: you draw it down steadily, then top up in fixed lots — useful when outflows are predictable. The Miller-Orr model (right) sets an upper and a lower cash limit and a return point in between: when cash drifts too high you move the excess into securities, when it drops too low you sell securities to top up — useful when cash flow is lumpy and hard to predict. Most small businesses run an informal Miller-Orr in their heads: keep a floor in the account, sweep anything above a comfortable ceiling.
Cash balances come in four types, each held for a different reason:
- Transactions balance — the cash used to run day-to-day operations: payroll, suppliers, rent.
- Compensating balance — a minimum balance the bank requires you to keep in the account to offset part of the cost it carries when extending you a loan or credit.
- Precautionary balance — a cash reserve kept for an unforeseen emergency, so a bad month does not force you to borrow at short notice.
- Speculative balance — cash held ready to take advantage of an unpredictable but probable bargain, such as a supplier clearing stock cheap.
Capital Budgeting
The process in which a business determines whether projects are worth pursuing. A prospective project’s lifetime cash inflows and outflows are assessed in order to determine whether the returns generated meet a sufficient target benchmark.
There are a few standard ways to judge whether a project is worth the money:
- Return on investment — the return the project throws off relative to what you put in.
- Economic value-added — whether the project earns more than the cost of the capital tied up in it.
- Payback — how long it takes to get your money back. The payback period equals the cost of the project divided by its annual cash inflows. Quick to compute, but it ignores everything that happens after you break even and it ignores the time value of money.
- Discounted cash flow analysis — net present value and internal rate of return, which do account for the time value of money.
2. NPV and the goal of increasing shareholder value
Net Present Value (NPV) lets you compare future cash flows with present ones directly, by expressing every cash flow in terms of current peso value. Put plainly, it is the difference between the present value of a project’s future cash flows and the initial investment you have to make today. A few things to hold onto:
- The NPV rule — you grow the value of the business by investing in projects with a positive net present value, and passing on those with a negative one.
- Discount rate matters. Raise the discount rate and the NPV falls — the two move in opposite directions, because a higher required return makes a future peso worth less today.
- NPV is one of two discounted-cash-flow methods. The other is the internal rate of return (IRR), covered next.
NPV has three features worth knowing:
- Additivity — the NPVs of separate projects can be added together, so you can weigh a whole slate of projects the same way you weigh one.
- Built on the discounted-cash-flow model — it takes the time value of money into account, unlike payback.
- It is a measure of wealth — it maps directly to the ultimate objective of growing the value of the business, which is why it is the method most worth trusting.
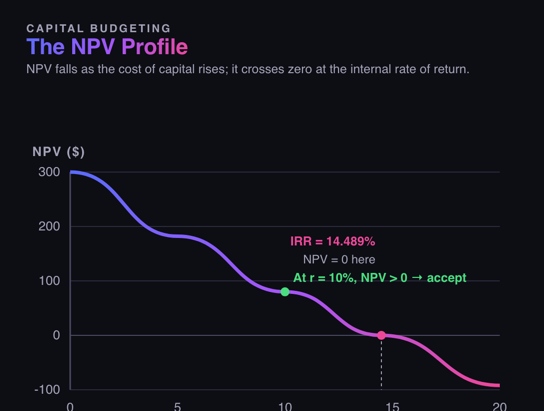
The curve shows how a project’s NPV falls as the cost of capital rises — the two move in opposite directions. In this example, at a 10% required return the NPV is positive, so you accept. The point where the curve crosses zero is the internal rate of return (IRR), here about 14.5%. Read simply: as long as your cost of money stays below the IRR, the project still adds value. For a small business, the “cost of capital” is just the return you could safely get elsewhere, or the rate your lender charges — if the project can’t beat that, the cash is better off elsewhere.
The pieces of the NPV formula are:
- IO — the initial outlay, the cash you spend up front to get the project going.
- CF — the cash flows the project generates in each period.
- r — the required rate of return, which reflects the risk-return trade-off: riskier projects demand a higher r.
- n — the number of periods over which the project runs.
General Formula:
NPV = -IO + CF1 + … + CFn
(1+r)1 (1+r)n
The Internal Rate of Return (IRR) is the discount rate at which a project’s NPV equals zero — in effect, the project’s own built-in rate of return. The IRR rule follows simply: take the project when its IRR is greater than your opportunity cost of capital, and pass when it is lower. If the project earns more than the next-best use of the same money, it is worth doing.
IRR is intuitive, but it has traps you need to watch for:
- Multiple IRRs — when a project’s cash flows switch between positive and negative more than once, the math can produce more than one IRR, and none of them means much on its own.
- Mutually exclusive projects — when you can only pick one, IRR and NPV can point at different choices. That is where the incremental IRR approach comes in: you run the IRR on the difference between the two projects.
- Capital rationing — when your capital is limited, ranking purely by IRR can steer you wrong.
- Unequal lives — comparing long-lived against short-lived equipment on IRR alone is misleading, because the two do not cover the same span of time.
- Replacement and investment timing — the question of when to replace an asset or start a project also distorts a plain IRR comparison.
When you run a discounted-cash-flow analysis, follow a few guidelines so the numbers mean something:
- Discount cash flows, not profits. Accounting profit is not the same as cash in the bank; DCF works on actual cash.
- Discount incremental cash flows — the cash flows with the project minus the cash flows without it. In practice: include all indirect effects; forget sunk costs, which are already spent and cannot be recovered, but do recognize the depreciation tax shield; include opportunity costs, such as income from a use you are giving up; and recognize the investment tied up in working capital.
- Discount nominal cash flows with a nominal cost of capital. Keep both consistent — do not pair a rate that includes inflation with cash flows that do not.
- Assume all-equity financing. Separate the investment decision from the financing decision, so you judge the project on its own merits and not on how it happens to be funded.
The cost of capital is the rate of return your investors could expect to earn if they put their money into equally risky securities somewhere else. It is a function of risk and the time value of money — the more risk, and the longer the wait, the higher the return people demand. A few rules of thumb hold across almost every business:
- Debt is the least expensive source of capital — lenders take the least risk, so they accept the lowest return, and the interest is tax-deductible.
- Equity is the most expensive source of capital — shareholders take the most risk, so they demand the most.
- Retained earnings are a form of equity, but they cost less than raising fresh equity, because the money is already in your hands and under your control — no issue costs, no new investors to answer to.
Costs of financing, cheapest to most expensive. As a rough ladder, the sources of money run from least costly at the top to most costly at the bottom:
- Bank and senior debt — first in line to be repaid, so it carries the lowest cost.
- Junior and subordinated debt — repaid after senior debt, so it costs a little more.
- Preferred stock.
- Retained profits.
- Common stock, whether raised from the public or from private investors — the most expensive, because common shareholders take on the most risk.
Yield curve. A normal yield curve is one where longer-maturity bonds pay a higher yield than shorter-term bonds — the longer your money is locked up, the more return you demand for the added risk that time brings.
Computing returns. The market rate of interest is the required rate of return on a debt instrument. An investor who holds the instrument all the way to maturity earns exactly that rate — which is why it is also called the yield to maturity.
Rate of return on equity. The return on equity instruments comes from two sources: dividends and capital appreciation (the share rising in price). Put together, the total equity return equals the dividend yield plus the capital gain expressed as a percentage of the price.
Risk Variability Returns

Risk is the spread or dispersion of possible outcomes (returns) on an investment, measured by the variance or standard deviation of those returns. The table below is Philippine data — monthly rates of return by asset class, 1987 to 2000 (source: Ybanez, 2002). Note how the riskier asset (common stocks) carries the widest standard deviation, while treasury bills and deposits sit tight around their means.
| Asset Type | Arithmetic Mean (%) | Standard Deviation (%) | Geometric Mean (%) |
|---|---|---|---|
| Common Stocks | 1.31 | 11.36 | 0.71 |
| Treasury Bills | 1.21 | 0.41 | 1.20 |
| Time Deposits | 1.01 | 0.38 | 1.01 |
| Dollar Deposits | 0.99 | 2.36 | 0.97 |
| Savings Deposits | 0.69 | 0.23 | 0.69 |
| Inflation | 0.75 | 0.66 | 0.74 |
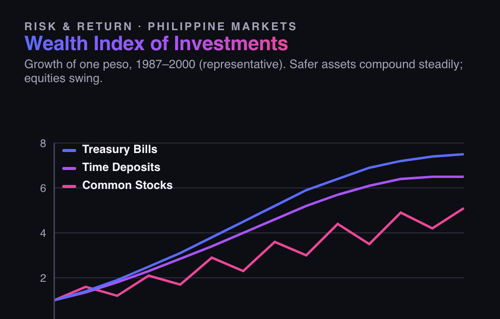
This chart tracks what one peso grew into across Philippine asset classes from 1987 to 2000. T-bills and time deposits compound to the highest end values here, while equities show the wildest swings along the way — the visual version of the risk-return trade-off. Read against the three benchmarks that follow: the risk-free rate (government securities), the market rate of return for risky assets, and the market risk premium — the extra return investors demand for taking on risk, equal to the market return less the risk-free rate.
Benchmarks for Risk: the risk-free rate and Market Risk Premium
There are three risk-return benchmarks worth anchoring to:
- Risk-free rate — the return on government securities, treated as the safest return available.
- Market rate of return — the return on all risky assets taken together, that is, what you would earn holding a portfolio that tracks the stock market index.
- Market risk premium — the extra return investors require for putting money into a risky asset instead of a safe one. It equals the market return minus the risk-free rate.
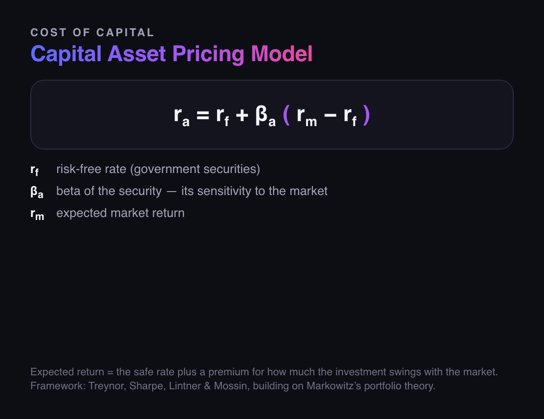
Capital Asset Pricing Model (CAPM) — the expected return on a stock, given its risk:
- Expected Return (ra) = rf + ?a x (rm – rf)
- rf = risk-free rate (government securities)
- ?a = beta of the security (its sensitivity to market movements)
- rm = expected market return
In plain terms: start with the safe rate, then add a premium for how much this particular investment swings with the market. A beta of 1.0 moves with the market; above 1.0 is more volatile, below 1.0 is steadier.
Risk and diversification. Risk splits into two kinds. Unique risk is the risk you can eliminate by diversifying — spread your money across enough different investments and the company-specific surprises tend to cancel out. Market risk is the part you cannot diversify away: the vulnerability to macroeconomic shifts that move all stocks at once. No amount of spreading protects you from a recession.
Beta and the capital asset pricing model
The sensitivity of an individual stock to market risk/movements is called its beta.
1. The average beta of all stocks is 1.0.
2. If beta > 1.0, the stock is particularly sensitive to market fluctuations. If beta < 1.0, the security is not so sensitive.
3. The expected return of any stock is a function of the risk free rate, the market risk premium, and its beta. This is the CAPM.
Cost of Capital and Capital Budgeting
1. The cost of capital used for capital budgeting purposes depends on the project’s risk. If the project being evaluated is of the same risk as the company’s existing businesses, then the company’s cost of capital is the appropriate discount rate for the project.
2. Companies adjust corporate WACC if the project being considered is not of the same risk as their existing businesses.
3. The discount rate should NOT be adjusted for possible errors or variability in forecast cash flows. Cash flows used for DCF analysis should be expected cash flows that already reflect the probabilities of all possible outcomes, good and bad. Potential bad outcomes should be reflected in the discount rate only to the extent that they affect beta.
Effect of Capital Structure on Cost of Capital
1. When a firm issues both debt and equity securities, its cost of capital must be a weighted average of the returns demanded by debt and equity investors.
2. The weights are based on the relative market values of debt and equity in the firm’s capital structure.
3. Cost of equity may be based on CAPM; cost of debt should be net of tax.
4. Risk Return Trade-off – The principle that potential return rises with an increase in risk. Low levels of uncertainty (low-risk) are associated with low potential returns, whereas high levels of uncertainty (high-risk) are associated with high potential returns. According to the risk-return tradeoff, invested money can render higher profits only if it is subject to the possibility of being lost.
Corporate Financing
Corporate financing comes down to two basic decisions:
- How much profit should be plowed back into the business rather than paid out as dividends? This is the firm’s dividend policy.
- What proportion of the deficit should be financed by borrowing rather than by an issue of equity? This is the firm’s debt policy.
For an owner that is the whole game in miniature: how much of this year’s profit stays in the business, and how much of what you still need comes from a lender instead of your own pocket.
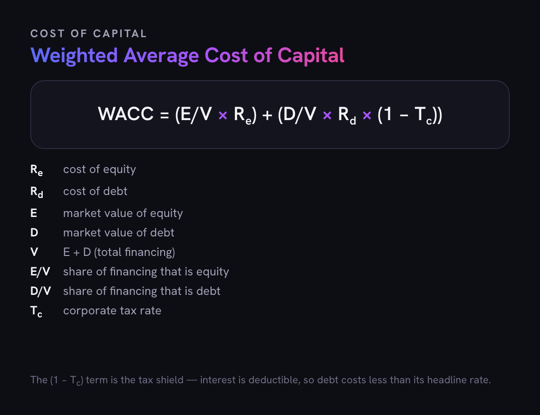
Weighted Average Cost of Capital (WACC) — the blended cost of the firm’s debt and equity:
- WACC = (E/V x Re) + (D/V x Rd x (1 – Tc))
- Re = cost of equity
- Rd = cost of debt
- E = market value of the firm’s equity
- D = market value of the firm’s debt
- V = E + D (total financing)
- E/V = percentage of financing that is equity
- D/V = percentage of financing that is debt
- Tc = corporate tax rate
The (1 – Tc) term is the tax shield: interest is tax-deductible, so debt costs the business less than its headline rate. For an owner weighing a bank loan against putting in more of your own money, WACC is the honest hurdle rate — any project has to clear this blended cost to be worth doing.
Firms lean on internal funds — retained profit — for two reasons:
- The cost of issuing new securities is avoided.
- The announcement of a new equity issue is usually bad news for investors, who worry that the decision signals lower future profits or higher risk.
Common Stock
- Authorized share capital — the maximum number of shares that can be issued.
- Issued and outstanding — shares held by investors.
- Treasury shares — shares held in the company’s treasury until they are either canceled or resold; issued but not outstanding.
- Par value — the value at which issued shares are entered into the company’s books; it has little economic significance.
- Additional paid-in capital — the difference between the price at which new shares are sold and the par value of those shares.
- Majority voting — each director is voted on separately and stockholders can cast one vote for each share they own.
- Cumulative voting — directors are voted on jointly and stockholders can allot all their votes to just one candidate.
Preferred Stock
- Offers a series of fixed payments to the investor.
- The company can choose not to pay a preferred dividend, but in that case it may not pay a dividend to its common stockholders either.
- Cumulative preferred stock — the firm must pay all past preferred dividends before common stockholders get a cent.
Debt
- A promise to make regular interest payments and to repay the principal.
- This liability is limited — stockholders have the right to default on the debt if they are willing to hand over the corporation’s assets to the lenders (but they will do this only if the value of the assets is less than the amount of the debt).
- Lenders do not have any voting power.
- Interest payments are regarded as a cost and are deducted from taxable income (interest is paid from before-tax income, whereas dividends are paid from after-tax income).
The mixture of loans a company chooses reflects its answers to a handful of questions:
- Should the company borrow short-term or long-term?
- Should the debt be fixed or floating rate?
- Should you borrow dollars or some other currency?
- What promises should you make to the lender?
- Senior debt — first to be repaid, before junior or subordinated debt.
- Secured debt — the firm sets aside some of its assets (collateral) specifically for the protection of the creditor.
- Should you issue straight or convertible bonds (which give the option to exchange the bond for a predetermined number of shares)?
The main contributions of financial intermediaries are:
- Providing a payment mechanism.
- Borrowing and lending — channeling savings toward those who can best use them.
- Pooling risk.
Debt Policy
Capital structure – the firm’s mix of different securities
The aim is to find the combination of securities that has the greatest overall appeal to investors — the combination that maximizes the market value of the firm.
Modigliani and Miller – propositions depend on PERFECT CAPITAL MARKETS! Payout policy doesn’t matter in perfect capital markets; also showed financing decisions don’t matter in perfect markets
Proposition I: The market value of any firm is independent of its capital structure.
- As long as investors can borrow or lend on their own account on the same terms as the firm, they can “undo” the effect of any changes in the firm’s capital structure.
- Firm value is determined on the left-hand side of the balance sheet by real assets.
- We implicitly assume that both companies and individuals can borrow and lend at the same risk-free rate of interest.
- Leverage increases the expected stream of earnings per share but not the share price — the change in the expected earnings stream is exactly offset by a change in the rate at which the earnings are capitalized.
Proposition II: The expected rate of return on the common stock of a levered firm increases in proportion to the debt-equity ratio (D/E), expressed in market values. The rate of increase depends on the spread between rA, the expected rate of return on a portfolio of all the firm’s securities, and rD, the expected return on the debt.
- rE = rA if the firm has no debt.
- rA = expected operating income / market value of all securities.
- The borrowing decision does not affect the expected return on the firm’s assets, rA.
- rA = (proportion of debt x expected return on debt) + (proportion of equity x expected return on equity), that is rA = (D/(D+E) x rD) + (E/(D+E) x rE).
- Rearranged: rE = rA + D/E (rA – rD).
- As the firm borrows more, the risk of default increases and the firm is required to pay higher rates of interest.
- The more debt the firm has, the less sensitive rE is to further borrowing.
- As the firm borrows more, more of that risk is transferred from stockholders to bondholders — holders of risky debt bear some of the firm’s business risk.
- How can shareholders be indifferent to increased leverage when it increases expected return? Because any increase in expected return is exactly offset by an increase in risk, and therefore in shareholders’ required rate of return.
- The same logic holds for beta: betaA = (D/(D+E) x betaD) + (E/(D+E) x betaE), so betaE = betaA + D/E (betaA – betaD).
- Investors require higher returns on levered equity because the required return simply rises to match the increased risk.
WACC (weighted-average cost of capital): WACC = rA = (D/V x rD) + (E/V x rE).
Market imperfections — debt policy DOES matter. In the real world, three things break the perfect-markets result:
- Taxes.
- The costs of bankruptcy and financial distress.
- Conflicts of interest, and information and incentive problems.
Corporate Taxes
- Interest is tax-deductible; dividends and retained earnings are not.
- The return to bondholders therefore escapes taxation at the corporate level ? the tax shield.
- PV(tax shield) = corporate tax rate x debt = Tc x D.
- The firm’s objective should be to arrange its capital structure so as to maximize after-tax income.
- Relative tax advantage of debt = (1 – Tp) / [(1 – TpE)(1 – Tc)], where Tp is the personal tax rate on interest and TpE is the effective personal rate on equity income.
- If all equity income comes as dividends, debt and equity income are taxed at the same effective personal rate, so the relative advantage depends only on the corporate rate: relative advantage = 1 / (1 – Tc).
- Value of the firm = value if all-equity-financed + PV(tax shield).
- The value of interest tax shields may be overstated: it is wrong to think of debt as fixed and perpetual, and you cannot use interest tax shields unless there will be future profits to shield.
Costs of Financial Distress
- Financial distress occurs when promises to creditors are broken or honored with difficulty.
- Value of firm = value if all-equity-financed + PV(tax shield) – PV(costs of financial distress).
- PV(tax shield) initially rises as the firm borrows more, but at some point the probability of financial distress climbs rapidly with additional borrowing.
- Tradeoff Theory of Capital Structure — the theoretical optimum is reached when the present value of tax savings from further borrowing is just offset by the increase in the present value of the costs of distress. Target debt ratios vary from firm to firm; companies with safe, tangible assets and plenty of taxable income to shield ought to have high target debt ratios.
Bankruptcy costs
- Corporate bankruptcies occur when stockholders exercise their right to default.
- Limited liability lets stockholders simply walk away from trouble, leaving it to the creditors; the former creditors become the new stockholders.
- Bankruptcy is merely a legal mechanism for letting creditors take over when the decline in the value of assets triggers a default. Bankruptcy is not the cause of the decline in value but the result.
- Bankruptcy costs are the costs of using this legal mechanism.
Agency costs
The more the firm borrows, the greater the temptation to play games at the lenders’ expense — for example, “cash in and run,” or “playing for time.”
The Pecking Order of Financing Choices
- Asymmetric information — managers know more about their companies’ prospects, risks, and values than outside investors do.
- Pecking order — investment is financed first from internal funds (primarily reinvested earnings), then by new issues of debt, and finally by new issues of equity.
Implications of the pecking order:
- Firms prefer internal finance.
- They adapt their target dividend payout ratios to their investment opportunities, while trying to avoid sudden changes in dividends.
- Sticky dividend policies, plus unpredictable swings in profitability and investment opportunities, mean that internally generated cash flow is sometimes more than capital expenditures and sometimes less. If it is more, the firm pays off debt or invests in marketable securities; if it is less, the firm first draws down its cash balance or sells marketable securities.
- If external finance is required, firms issue the safest security first — they start with debt, then possibly hybrid securities such as convertible bonds, then equity as a last resort.
Kinds of Debt
Foreign bonds — bonds sold to local investors in another country’s bond market.
Indenture (or trust deed) — the bond agreement between the borrower and a trust company (representing the bondholders) in the case of a public issue.
Bond price
- Shown as a percentage of face value.
- Stated net of accrued interest.
- Sometimes bonds are sold with a lower interest payment but at a larger discount to face value, so investors receive a significant part of their return as capital appreciation.
Zero-coupon bond — pays no interest at all; the entire return consists of capital appreciation.
Debentures — longer-term unsecured issues.
Notes — shorter-term issues.
Mortgage bonds — form the majority of secured debt.
Asset-backed securities — created when companies bundle up a group of assets and then sell the cash flows from those assets.
Sinking fund — part of the issue is repaid on a regular basis before maturity.
Call option
- Allows the company to pay back the debt early.
- Exercised when interest rates fall and bond prices rise, letting the firm reissue at a higher price and a lower interest rate.
- Call the bond when, and only when, the market price reaches the call price.
Puttable bonds — give investors the option to demand early repayment.
Extendible bonds — give investors the option to extend the bond’s life.
Project finance — debt supported by a particular project.
Dividend Policy
Dividend policy – the trade-off between retaining earnings on the one hand and paying out cash and issuing new shares on the other
In practice, how much a firm pays out is shaped by several factors:
- Legal requirements.
- The firm’s liquidity position.
- Repayment needs.
- The expected rate of return on future investments.
- Stability of earnings.
- The desire to retain control.
- Access to the capital market.
- Shareholders’ individual tax situations.
Dividends
- Shares are sold cum dividend until a few days before the record date, at which point they trade ex dividend.
- Companies are not allowed to pay a dividend out of legal capital (the par value of outstanding shares).
- Dividends are taxed as ordinary income.
Forms of dividends
- Cash dividend — a regular or one-off special dividend.
- Stock dividend — like a stock split, it increases the number of shares, but the company’s assets, profits, and total value are unaffected, so it reduces the value per share.
- A stock dividend is shown in the accounts as a transfer from retained earnings to equity capital.
- A stock split is a reduction in the par value of each share.
Share repurchase
- Reacquired shares may be kept in the company’s treasury and resold if the company needs money.
- Stockholders who sell shares back to the firm pay tax only on the capital gains realized in the sale.
Lintner’s Model — stylized facts:
- Firms have long-run target dividend payout ratios.
- Managers focus more on dividend changes than on absolute levels.
- Dividend changes follow shifts in long-run, sustainable earnings.
- Managers are reluctant to make dividend changes that might have to be reversed.
Target dividend: DIV1 = target ratio x EPS1. Target change: DIV1 – DIV0 = (target ratio x EPS1) – DIV0.
- But shareholders prefer a steady progression in dividends, so a firm moves only partway toward its target payment: DIV1 – DIV0 = adjustment rate x (target ratio x EPS1 – DIV0).
- The more conservative the company, the lower its adjustment rate.
Information in Dividends and Stock Repurchases
- Most managers do not increase dividends until they are confident that enough cash will flow in to pay them.
- Announcements of dividend cuts are usually taken by investors as bad news (the stock price falls); dividend increases are good news (the stock price rises).
- Investors do not get excited about the level of a company’s dividend; they worry about the change.
- A company that announces a repurchase program is not making a long-term commitment to earn and distribute more cash.
- Companies repurchase shares when they have accumulated more cash than they can invest profitably, or when they wish to increase their debt levels. Shareholders are frequently relieved to see companies pay out the excess cash rather than fritter it away on unprofitable investments.
- Stock repurchases may also be used to signal a manager’s confidence in the future.
- When companies offer to repurchase their stock at a premium, senior management and directors usually commit to hold onto their own stock.
The Dividend Controversy: Does a dividend decision change the value of a stock, rather than simply providing a signal of stock value?
Rightists — a conservative group which believes that an increase in dividend payout increases firm value.
- There is a natural clientele for high-payout stocks.
- There is also a natural clientele of investors who look to their stock portfolios for a steady source of cash to live on.
- Dividends signal a more careful, value-oriented investment policy.
Leftists — a radical group which believes that an increase in dividend payout reduces value.
- Whenever dividends are taxed more heavily than capital gains, firms should pay the lowest cash dividend they can get away with; available cash should be retained or used to repurchase shares.
- Investors should pay more for stocks with low dividend yields, or accept a lower pretax rate of return from securities offering returns as capital gains rather than dividends.
Middle-of-the-road party — claims that dividend policy makes no difference.
- Modigliani and Miller showed the irrelevance of dividend policy in a world without taxes, transaction costs, or other market imperfections.
- The only way to finance an extra dividend is to sell shares, and the capital loss borne by old shareholders just offsets the extra cash dividend they receive.
- Old shareholders can cash in by selling some of their shares.
- Enough firms may already have switched to low-payout policies to satisfy the clientele’s demand fully, leaving no incentive for additional firms to switch.
- Taxes on dividends have to be paid immediately, but taxes on capital gains can be deferred until shares are sold and the gains are realized.
- Rule: adopt a target payout low enough to minimize reliance on external equity.
Dividend Theories
Dividend Irrelevance Theory
Much like their work on the capital-structure irrelevance proposition, Modigliani and Miller also theorized that, with no taxes or bankruptcy costs, dividend policy is also irrelevant. This is known as the “dividend-irrelevance theory”, indicating that there is no effect from dividends on a company’s capital structure or stock price.
In the determination of the value of a company, dividends are often used. However, MM’s dividend-irrelevance theory indicates that there is no effect from dividends on a company’s capital structure or stock price. MM’s dividend-irrelevance theory says that investors can affect their return on a stock regardless of the stock’s dividend.
Bird-in-the-Hand Theory
The bird-in-the-hand theory, however, states that dividends are relevant. Remember that total return (k) is equal to dividend yield plus capital gains. Myron Gordon and John Lintner (Gordon/Litner) took this equation and assumed that k would decrease as a company’s payout increased. As such, as a company increases its payout ratio, investors become concerned that the company’s future capital gains will dissipate since the retained earnings that the company reinvests into the business will be less.
Tax-Preference Theory
Taxes are an important consideration for investors. Remember that capital gains are taxed at a lower rate than dividends, so investors may prefer capital gains to dividends. This is known as the “tax-preference theory”.
Additionally, capital gains are not paid until an investment is actually sold. Investors can control when capital gains are realized, but, they can’t control dividend payments, over which the related company has control.
Dividend Signaling
A theory that suggests company announcements of an increase in dividend payouts act as an indicator that the firm has strong future prospects. The rationale behind dividend-signaling models stems from game theory: a manager with good investment opportunities is more likely to “signal” than one who does not, because it is in his or her best interest to do so.
Clientele Effect
The theory that a company’s stock price moves according to the demands and goals of investors in reaction to a tax, dividend, or other policy change affecting the company. The clientele effect assumes that investors are attracted to different company policies, and that when a company’s policy changes, investors adjust their stock holdings accordingly. As a result of that adjustment, the stock price moves.
Relevant Formulas
Dividend Valuation Models
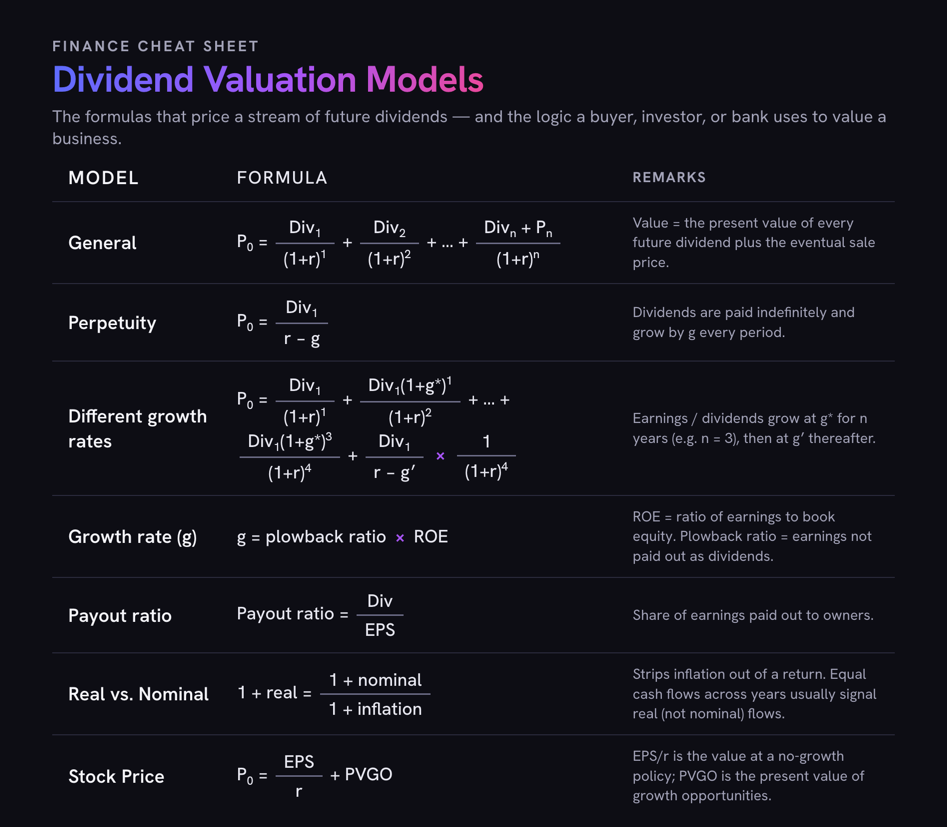
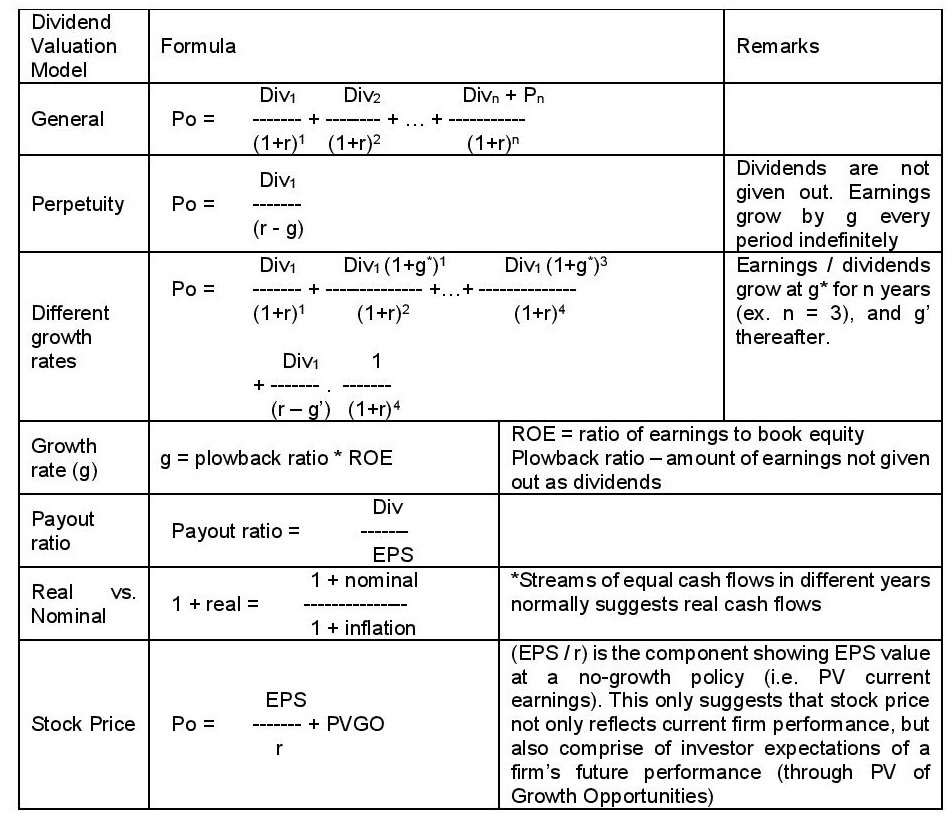
The formula sheet above, written out so you can copy it. P0 is today’s fair price of the stock; Div is the dividend; r is the required return; g is the growth rate.
Most Philippine MSMEs are not publicly traded, so you will not price your own shares this way. Where it earns its keep is the reverse: it is the logic a buyer, an investor, or a bank uses to value your business — a stream of future cash, discounted for time and risk. Growing that stream (g) and lowering the risk attached to it (r) is what raises the number.
| Model | Formula | Remarks |
|---|---|---|
| General | P0 = Div1/(1+r)1 + Div2/(1+r)2 + … + (Divn + Pn)/(1+r)n | Value = the present value of every future dividend plus the eventual sale price. |
| Perpetuity | P0 = Div1 / (r – g) | Dividends are paid indefinitely and grow by g every period. |
| Different growth rates | P0 = Div1/(1+r)1 + Div1(1+g*)1/(1+r)2 + … + Div1(1+g*)3/(1+r)4 + [Div1/(r – g’)] x [1/(1+r)4] | Earnings/dividends grow at g* for n years (example n = 3), then at g’ thereafter. |
| Growth rate (g) | g = plowback ratio x ROE | ROE = ratio of earnings to book equity. Plowback ratio = earnings not paid out as dividends. |
| Payout ratio | Payout ratio = Div / EPS | Share of earnings paid out to owners. |
| Real vs. Nominal | 1 + real = (1 + nominal) / (1 + inflation) | Strips inflation out of a return. Equal cash flows across years usually signal real (not nominal) flows. |
| Stock Price | P0 = EPS / r + PVGO | EPS/r is the value at a no-growth policy; PVGO is the present value of growth opportunities — the price also reflects investor expectations of future performance, not just current earnings. |
Turn these numbers into decisions
The formulas above tell you where a business stands; acting on them is the harder part. RM Nisperos helps Philippine business owners and finance teams put these ratios, cash cycles, and capital decisions to work. Book a free strategy call »


What the hell is SHE?? the acronym is nowhere to be found and not explained…..
Also debt isn’t total liabilities, debt is a liability but it isn’t ALL liabilities.
Otherwise very helpful. but these parts are extremely confusing
It’s Shareholders Equity. Technically it is but debt is just a common term used for liability.
Thanks FOR YOUR GREAT FINANCE IFORMATION I WAS LOOKING TO FIND IT EVERY WHERE
2.1 A firm projects an ROE of 18%; it will maintain a payout ratio of 40%. The firm is
expecting earnings of R3 per share and investors expect a return of 15% on the
investment. Calculate the expected share price and the P/E ratio of the firm
How would you solve this question
This cheat sheet is incredibly helpful! The way you simplified complex formulas and concepts makes them so much easier to grasp. Thank you for putting this together—it’s going to be a great reference for my studies!
This finance cheat sheet is incredibly helpful! I appreciate the clear explanations of each formula and concept. It makes complex topics much more accessible. Thanks for putting this together, RM NISPEROS!