Table of Contents
The Operations Function
Operations & SC Strategy
Product Design
Process Selection
Service Process Design
Choice of Technology
Process-flow Analysis
Supply Chain Management
Independent-Demand Inventory
Facilities & Aggregate Planning
Material Requirements Planning
Just-In-Time Systems & Lean Thinking
Quality Management
The Operations Function
Operations Management, as a field, deals with the production of goods & services. It is defined as decision making in the operations function & integration of these decisions with other functions.
The unifying feature of service & manufacturing operations is that both can be viewed as transformation processes.
[Input: raw materials, energy, labor & capital] -> [Output]
Operations create wealth in the global economy, & thus we cannot survive & prosper without them.
Wealth creation occurs when the value of outputs in goods & services exceeds the cost of inputs used; to raise productivity [= output/input] output > input.
Four Major Decision Responsibilities of Operations Management
1. Process. Decisions on this category determine the physical process or facility used to produce the product or service & the associated workplace practices – a type of equipment, process flows, the layout of the facility, job design & workforce policies.
2. Quality. Quality decisions must ensure that quality is designed & built into the product in all stages of operations – standards must be set, people trained & the product or service inspected.
3. Capacity. Must be aimed at providing the right amount of capacity at the right place at the right time – scheduling of people, equipment & facilities.
Short-range: subcontracting, extra shifts, rental
Long-range: the size of the physical facilities, suppliers.
4. Inventory. Determine what to order, how much to order & when to order; management of the flow of materials within the firm & within the SC.
Functional areas are concerned with a particular focus of responsibility or decision making in an organization.
Three Primary Functions: Marketing, Operations & Finance. Three Supporting Functions: Human Resources, Information Systems & Accounting
Seven Contemporary Themes in Operations
(1) Services & manufacturing; (2) Customer-directed operations; (3) Lean Operations – concerned with eliminating waste (non-value adding) activities in every part of operations & the business; integration of operations with other functions; environmental concerns, SC management, & globalization of operations.
Operations & SC Strategy
“Creating an organization of highly motivated people is extremely hard to duplicate…” The strategy for the operations function must be linked to the business strategy & other functional strategies, leading to a consistent pattern of decisions, unique capability, & competitive advantage for the firm.
Corporate Strategy – defines what business the company is pursuing.
Business Strategy – defines how a particular business will compete.
Four Elements of Operations Strategy
1. Mission. Derived from the particular business strategy selected by the business unit.
2. Distinctive Competence. Something that operations do better than anyone else. [or operations capability]
Example: Cross-docking – goods from suppliers’ trucks are transferred across the loading dock to waiting trucks & delivered to stores without entering the warehouse.
- Price – Low Costs
- Quality – High Performance
- Time – Rapid Delivery (FEDEX, Pizza Hut)
- Flexibility – Variety, Volume (Mass Customization, Personalization)
- Service – Superior Customer Service (Zappos, Disneyland)
- Location – Convenience (ATM, Banks)
3. Objectives
- Competing through Quality – satisfying customer requirements, superior product attributes
- Low-cost Objective – to focus on customer requirements in both product design & operations.
- Delivery Time – reducing machine change-over time, moving processes closer together.
- Flexibility – either by adding capacity, redesigning the product for high variety (new-product introduction).
These objectives can work in concert if non-value-adding activities are removed from operations. One of the four objectives should be selected as an order winner; the others are order qualifiers.
Order winner – an objective that will win orders from the customers in a particular segment that marketing has selected as the target market.
Order Qualifier – acceptable levels of these objectives are needed to qualify to get the order.
Policies. Indicate how the operation’s objectives will be achieved. It should be developed for each of the major decision areas (quality, process, inventory, capacity).
Business Strategies
Product imitator (operational excellence) – typical of a mature, price-sensitive market with a standardized product. [Standardization, superior processes]
Product innovation & new product introduction (product leadership) – used in an emerging possibly growing market where advantage can be gained by bringing out superior quality products in a short amount of time. [Customization, superior products]
Operations Competence
Resources or capabilities that are difficult to imitate:
- Skills of employees that can’t be easily learned;
- Proprietary equipment or processes that are patented or otherwise protected;
- Ability to continuously learn & improve operations at a rapid pace;
- Partnerships with customers or with suppliers that are developed over the long run;
- Advantageous location for facilities gained by being the first mover;
- Organizational knowledge that has been built up internally over time;
- Proprietary or unique information & control systems.
Resource-based view – advocates building strategy on resources that are rare, valuable, inimitable & non-substitutable consistent with a sustainable distinctive competence.
In some situations the basis of competition is not the firm, but the entire Supply Chain. Supply Chain strategy is an extension of operations strategy that considers not only the firm but also the strategies of its Supply Chain partners.
Product Design
Product Design – refers to either a physical, manufactured product or service; result in the development of a business strategy.
Strategies for New-Product Introduction
A. Market Pull. The market is the primary basis for determining the products a firm should make, with little regard for existing technology. “A firm should make what it can sell”.
B. Technology Push. Technology is the primary determinant of the products that the firm should make, with little regard for the market.
C. Interfunctional View. The product should not only fit the market needs but should have a technical advantage as well. All functions should cooperate to design the new products needed by the firm (cross-functional teams).
New-Product Development Process
ISO9000 – standard that applies to new-product development to ensure that quality products are designed & manufactured.
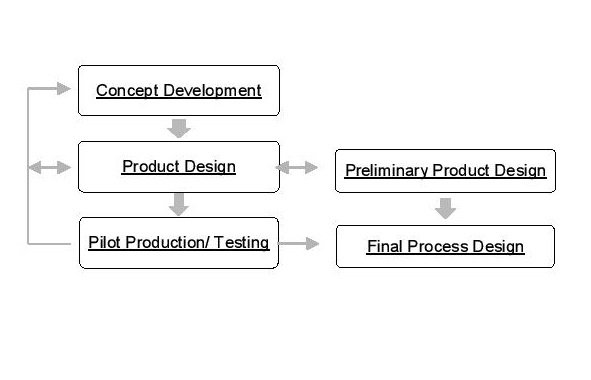
I. Concept Development. This phase is concerned with the idea generation & evaluation of alternative ideas for the new product. The physical product is NOT YET designed. The decision to proceed to the product design phase will ordinarily require top management approval. At the time of the approval a cross-functional team will be established, to actually design the new product.
II. Product Design. Concerned with designing the physical new product. At the end of the product design phase, the firm has a set of product specifications & engineering drawings specified in sufficient detail that production prototypes can be built & tested. Process Design should take place simultaneously with product design.
III. Pilot Production/Testing. Complex products require testing of production prototypes before they are actually put into production. To facilitate transition from design to production, an information package should be finalized that contains not only product specifications but also process design specifications, training procedures for operators & test results.
Cross-Functional Design
Products should be designed for manufacturability. This is done by considering design of the production process as part of product design & utilizing a concurrent engineering approach.
Concurrent Engineering – simultaneous development process; overlapping phases for product design instead of the sequential approach.
• Typically, an NPD team is formed with representation from all major functions to ensure cross-functional integration.
Quality Function Deployment (QFD) – or “House of Quality”, tool for linking customer requirements as defined by the customer to technical specifications [connect customer attributes to engineering characteristics]; facilitates interfunctional cooperation between marketing, engineering & manufacturing.
Design for Manufacturing (DFM) – approach that consists of two things:
1. Product Simplification. via Value Analysis
2. Modular Production. Manufacture of multiple products using common parts, processes & modules.
DFM removes unnecessary parts & makes the product easier to make.
I. Value Analysis –or value engineering, a method for improving the usefulness of a product without increasing its cost or reducing the cost without reducing the usefulness of the product.
Value = Usefulness/Cost
Cost – an absolute term & measures the amount of resources used to produce the product.
Usefulness – relative term describing the functionality that the customer ascribes to the product; can be described by such terms as product features, performance or reliability of the product.
In value analysis:
Objective – the primary purpose of the product.
Basic Function ¬– if eliminated, would render the product useless in terms of its stated objective
Secondary Function – function that is the result of the way the product is designed; permits accomplishment of the basic function.
Value analysis is the process of examining secondary functions to see if an alternative can be identified that will improve the value ratio.
II. Modular Design – makes it possible to have relatively high product variety & low component variety at the same time.
The core idea is to develop a series of basic product components, or modules that can be assembled into a large number of different products & considering only the combinations of options that have significant market demand. To the customer, it appears there are a great number of different products.
To operations, there are only a limited number of basic components & processes. This makes it possible to produce more efficiently for larger volumes while also allowing standardization of processes & equipment.
Process Selection
These are in terms of Product Flow or Customer Type. The considerations required for process selection include the volume of the product & whether the product is standardized or customized. Process selection decisions are strategic in nature; it tends to be capital intensive & cannot be easily changed.
Product Flow Characteristics (Line, Batch or Project)
Same as the flow of materials, since materials are being converted into the product.
A. Line Flow – linear sequence of operations like an assembly line; the product moves from one step to the next in a sequential manner from beginning to end.
[Sequential flow, product layout]
• Very efficient but very inflexible. It requires high volume of products that are standardized. At the same time, this makes it difficult to make changes in the product itself or the volume of flow leading to inflexibility of operations.
• Line flow generally requires a large amount of capital investment & must have a high volume to justify the investment.
i. Mass Production – use of assembly lines to assemble discrete parts into a finished product.
ii. Continuous Production – process industries such as beer, paper, oil & electricity; highly standardized & automated with very high volumes of production.
B. Batch Flow – production of the products in batches or lots. Each batch of the product flows from one operation/work center to another; can be used to make many different products.
[Jumbled flow, process layout]
Work Center – group of similar machines or processes used to make the product.
• Use general-purpose equipment that is not specialized to make just one particular product.
• Labor is highly skilled & flexible in its ability to make different products. Equipment configured to be more flexible than a line flow process.
• Batch flow can be justified when the volume is low or there are many different products.
• The jumbled flow reduces throughput time & efficiency.
C. Project Flow – used for unique or creative products; concerts, construction of buildings or large aircraft.
• The product doesn’t flow in a project since materials are brought to the project itself is stationary.
• Each unit is made individually & is different from other units.
• Project flow can be justified when customer desires customization & uniqueness. It requires intensive planning & scheduling & generally results in costly products or services.
Type of Customer Order
A. Make-to-Stock (MTS) – keyed to replenishment of inventory. [standard products]
• The replenishment cycle for inventory is separate from the customer order cycle.
• Provide faster service to customers from available stock & lower costs.
• Key Performance Measures: length of time it takes to design & make the product, lead time; percentage of orders completed on time.
B. Make-to-Order (MTO) – keyed to customer orders.
• Has higher flexibility for product customization. [custom orders]
• Key Performance Measures: percentage of orders filled from inventory, service levels; inventory turnover; capacity utilization.
• Critical Management Tasks: forecasting, inventory management & capacity planning.
C. Assemble-to-Order (ATO) – hybrid of MTS & MTO; builds up subassemblies in advance of demand & then puts them together at the last minute to satisfy customer demand [subassemblies is to MTS as final assembly is to MTO].
• Products must be designed in a modular fashion
Four Factors that Influence Process Selection: Market Conditions, Capital Requirements, Labor & Technology
Product-Process Matrix
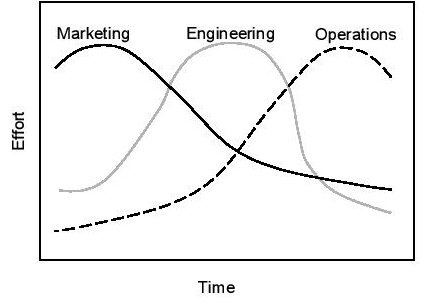
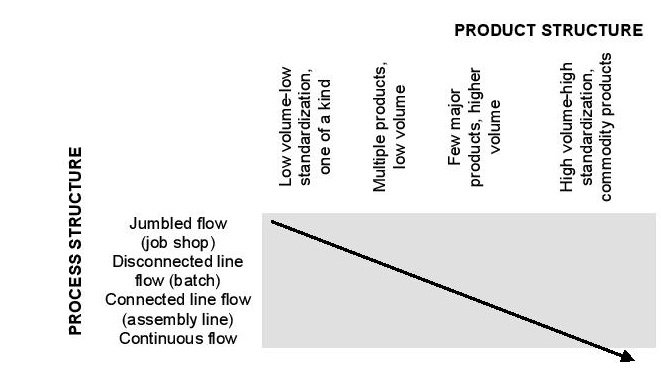
Provides a dynamic view of the process selection decision by considering the life cycle of both products & processes. The strategy is defined by a patch on the matrix for particular combinations of products & process. The matrix helps provide coordination between marketing & operations decisions about products & processes, respectively. The diagonal of the matrix represents a match between the product & process.
Focused Operations
Arranging different products with different missions as plant-within-a-plant (PWP), which may sacrifice some economies of scale while doing a better job of meeting customer requirements & improving profitability. Used to separate products & processes that have different volume requirements or different levels of standardization.
Mass Customization
Traditional mass production is built on economies of scale, by means of a high-volume standardized product with few options while mass customization depends on economies of scope, high variety of products from a single process. It focuses on common processes rather than a common product. Customization at approximately the same cost as mass production. This is a stringent requirement & means that some products cannot be mass-customized because the cost would be higher.
The Four Forms of Mass Customization are
1. Mass-customized services.
2. Modular Production. Provide a variety of options using ATO processes.
3. Fast Changeover. It is critical that production is computer controlled & each order uniquely identified by a bar code that specifies customer’s options.
4. Postponement. Used to defer a portion of the product until the point of delivery.
Service Process Design
Services – produced & consumed simultaneously; intangible; most of which cannot be stored/transported; customers can introduce uncertainty.
Service-Product Bundle
1. Physical Goods (Facilitating Goods)
2. Tangible Service Provided (Explicit Service)
3. Psychological Service (Implicit Service)
Service Recovery – ability to quickly compensate for the failure & restore, if possible, the service required by the customer.
Service Guarantee – builds customer loyalty & clarifies exactly what the service process must provide; an assurance that the service provider will actually perform as promised.
Moments of Truth – contact with a service system.
Perceived Service = f(All previous moments of truth)
For high-contact service systems
Potential inefficiency = f(degree of customer contact)
Degree of contact – amount of time that the customer is in the system while the service is being produced.
• Front room operations require intensive customer interaction, while backroom (low-contact services) operates more like the traditional factory.
Service-Profit Chain. Customer loyalty is the key to profitability; indicates how customer satisfaction & loyalty along with employee satisfaction & loyalty are important to profitability
External Service Value = Benefits the customer perceives – the cost incurred in obtaining the service
Service Matrix
Degree of interaction & customization – uncertainty & variety introduced into operations by customers.
Degree of labor intensity – the amount of labor required in relation to capital utilized.
Choice of Technology
Technology – application of knowledge to solve human problems
Process technology – set of processes, tools, methods & equipment used to provide goods & services.
Computer-Integrated Manufacturing (CIM)
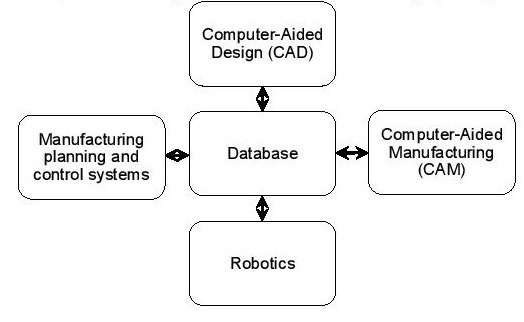
Common Database – integrates all manufacturing & business functions. When CIM system is extended to include accounting, order-entry, & sales information, it becomes an Enterprise Resource Planning (ERP) System, which forms the basis for cross-functional integration through shared information. CAM may well provide batch manufacturing companies with the efficiencies long enjoyed in the process & line-flow industries.
Group Technology/Cellular Manufacturing – the process of classifying parts by families & subsequently dedicating production equipment to a specific family or families of parts. CAM thus involves designing the manufacturing process & tooling through the database. This can be accomplished by organizing batch manufacturing, & even some assembly lines, by cellular manufacturing. This speeds up the flow of the product & increases machine utilization. CIM should be implemented in stages under the guidance of a master plan.
Economies of Scope – the ability to efficiently produce a variety of products rather than a large volume of standardized products. Technology investments should: (1) support a comprehensive technology strategy [integrated over time & help the firm achieve a competitive advantage], (2) meet financial objectives [the required ROI sets the minimum acceptable level that the technology strategy should meet or exceed] & (3) provide a socio-technical system [jointly choosing the jobs & technology at the same time].
Four Types of e-businesses: e-marketplace companies, e-service providers, e-retailers & wholesalers, & e-producers.
Process-flow Analysis
• The process view leads to the idea that a business is a set of horizontal processes that are interconnected with the objective of meeting customer needs.
System – a collection of interrelated elements whose whole is greater than the sum of its parts.
• The transformation system must be isolated from its environment by specifying the system boundary to separate the system under study from the larger system or organization.
Little’s Law: I = T x R
I =average number of things in the system (inventory)
T=average throughput time (flow time)
R=average flow rate into the process
Throughput time – the time from when the product first starts being produced in the factory until it is finished & shipped.
Capacity – the maximum rate of output of a process or the maximum flow rate that can be sustained over a period of time.
Bottleneck – most constraining resource; smallest capacity; determines the capacity of the entire process.
Flowchart Analysis (Process-Flow Analysis) – used to describe & improve the transformation process in business.
A. Materials-Flow Analysis – reducing manufacturing throughput time (cycle time), the total time to order, manufacture & distribute a product from beginning to end; seeking to reduce waste in the process using a flow-process chart.
Waste – any operation that does not add value during the production process, including the time the product sits in storage, the time the product is being moved from one location to another, inspection time, etc.
B. Information-Flow Analysis – either (1) information is the product of the operation [clerical processing in offices] or (2) information flow is used for management & control processes [order entry, purchasing documents].
C. Service Blueprinting – or service flows, flowcharting for service operations; shows the cycle of service, how the customer and service provider interact at each step of the service delivery process..
Business Process Reengineering (BPR) – used for a radical redesign of processes.
Four Principles of BPR: (1) organize around outcomes, not tasks; (2) have people who do the work process their own information; (3) put the decision point where the work is performed, & build control into the process; (4) eliminate unnecessary steps in the process.
Supply Chain Management
Supply Chain (SC) – a sequence of business processes & information that provides a product or service from suppliers through manufacturing and distribution to the ultimate customer.
SC Management – planning, design & control of the flow of information & materials along with the SC in order to meet customer requirements in an efficient manner, now & in the future.
According to systems thinking, all elements of the SC are interconnected & dependent on each other. The elements should be coordinated to achieve overall systems goals. The information feedback loop is critical to the effective management of SC.
Distribution Channel – route from the producer forward (downstream) through the distributors to the customer.
Demand Management – managing the demand for goods or services along with the SC. Demand can be managed through such mechanisms as products, pricing, promotion & distribution – tasks that are generally assigned to marketing.
Logistics Management – inbound transportation & outbound distribution.
Accelerator/Bullwhip Effect – as the demand change is magnified the further back you go in the SC; caused by replenishment lead times and information time lags; an additional consequence is the overshooting of the true demand.
Possible Solutions: shorten replenishment cycle, provide better forecasting, increase coordination within & between organizations.
SC Dynamics:
1. SC is a highly interactive system;
2. There is an accelerator effect of demand changes;
3. The best way to improve SC is to reduce the total replenishment time & to feedback actual demand information to all levels.
Coordination in the SC
To make improvements, it is important to increase coordination both across & within firms.
Functional Silos – separate departments that manage different aspects of the SC.
Coordination can be increased by cross-functional teams, partnerships with customers & suppliers, better information systems, a flatter organizational structure.
Measuring SC Performance
1. Delivery. On-time delivery – percentage of orders delivered complete & on the date requested by the customer.
2. Quality.
- Customer Satisfaction – measured relative to the customer’s expectations.
- Customer Loyalty – the percentage of customers who are still purchasing the product after having purchased it at least once.
3. Time.
Total Replenishment Time = level of inventory divided by usage rate.
Cash-to-cash Cycle/Business Cycle = Days in Inventory + Days in Accounts Receivable – Days in Accounts Payable
4. Flexibility. The maximum percentage of change in volume or product mix possible in a fixed period of time.
5. Cost.
Total Delivered Cost – includes manufacturing, distribution, inventory carrying costs and accounts receivable carrying costs.
Efficiency=(Sales-Cost of Materials)/(Labor+Overhead)
The volume of flexibility of the SC is the minimum volume of flexibility of all participants since that will be the most constraining part of the SC, the bottleneck.
The volume of flexibility = minimum (all participants’ volume flexibility)
SC Strategies
To identify the proper SC, companies should first sort their products into:
a. Functional Products – like commodities, they have predictable demand & low-profit margins; as a result, it should have a very efficient low-cost supply chain. [SC Strategy: Efficient SC]
b. Innovative Products – unpredictable demand & high-profit margins; they need flexible and fast SC to deal with uncertainty in demand. [SC Strategy: Flexible SC]
• Firms should not make the mistake of choosing only one SC strategy for all products.
• There are two basic ways to improve SC: (1) by changing structure [bricks and mortar] or (2) infrastructure [people and systems]
Structural Changes – include capacity, facilities, process technology, and vertical integration; long-range in nature & require considerable capital.
Infrastructure – people, organization, production & inventory control, information systems, & quality control systems; “soft side” of the SC. Reducing replenishment time is a major approach to SC improvement. Allows SC to react rapidly to real demand changes & reduces the inventory needed.
I. Structural Improvement: to remove sources of uncertainty or time
Five Forms of Structural Change of SC
1. Forward & Backward Integration. Ownership within the SC; allows for control of the SC
Total Vertical Integration – if one firm owns the entire SC.
Major Drawback: Loss of flexibility to changing technology or loss of economies of scale.
2. Major Process Simplification. Used to improve SC when processes are so complex or out of date.• A clean slate approach is used, where the processes are designed from scratch without regard for existing processes.
3. Change the number & configuration of suppliers, factories, warehouses or retail sites.
4. Major Product Design – postponement strategy & modular design
5. Outsourcing to a third party
Infrastructure change is made within a given structure or configuration of the SC.
II. Improvement in Infrastructure: to remove sources of uncertainty or time
1. Cross-functional teams. Often used to plan & control the master schedule for manufacturing; provide coordination across various departments & functions of a business.
2. Partnerships with suppliers & customers provide coordination across businesses just like cross-functional teams provide coordination within the business.
It starts with a commitment by both firms to establish a long-term mutually beneficial business relationship.
3. Set-up time reduction. Making changes quickly once the machine is no longer running so that it can be put back into production as soon as possible.
4. Changes in information systems. Sales data from final customers are feedback through the SC.
5. Cross-docking – a supplier’s shipments are taken from various docks at the warehouse when they arrive & transferred directly to a truck at another dock.
The item does not spend time in the warehouse inventory; they are simply moved from one dock to another.
The Internet and Supply Chains
Two Fundamental Processes in all SC:
1. Order placement. Include not only the actual entry of an order from the customer but the information supplied before the order is entered.
2. Order fulfillment.
• E-procurement plays an important role in both the placement & fulfillment process; allows a company to interact electronically with its supplier through BtoB connections.
Three Types of E-Procurement Services:
1. Online catalogs listing products, prices, specifications, sales, and delivery terms.
2. Third-party auctions for buyers & sellers.
3. Private exchanges conducted by major corporations.
Problems in E-Procurement:
1. Too much focus has been placed on technology without adequate attention to process redesign & process coordination issues.
2. Joint value propositions have not been carefully developed so that both partners benefit from the BtoB exchange.
3. There have been too many fragmented efforts across divisions within the same company & also fragmented approaches across companies.
4. Multitudes of record accuracy & data issues have plagued the process.
Virtual Corporation – produces a product or a service without facilities or people; it has no fixed assets on the balance sheet.
• It exists to coordinate other companies that do the design, production & distribution work.
• It quickly forms partnerships & dissolves them when the need no longer exists.
• A very flexible form of organization that responds quickly to changing conditions.
• Many firms only contract out a portion of their business & use traditional employees & assets for the core competencies. Using this approach, they protect their intellectual property & their knowledge of technology only in those areas where they plan to create a competitive advantage – core competency areas.
Virtual SC – consists of at least one virtual company that coordinates all the activities of the SC.
• No company owns the entire SC, but it can control the design of products & the movement through the SC by use of contracts & partnerships with other companies.
Independent-Demand Inventory
Inventory – is a stock of materials used to facilitate production or to satisfy customer demands; includes raw materials, work in process; & finished goods.
Inventory vs. Capacity
• Inventory is a product at some point in the conversion & distribution process while capacity provides the potential to produce.
• Inventory management greatly affects capital requirements, costs and customer service.
• The rate at which stock is replenished is the supply capacity & the rate of stock depletion is demand.
• Inventory acts as a buffer between the different demand & supply rates.
• One firm typically does not control all inventories; rather inventory must be coordinated across the SC partners.
Purpose of Inventories 1. To protect against uncertainties – like finished goods are maintained to absorb changes in demand without immediately changing production [Safety Stocks].
2. To allow economic production & purchase. Makes it possible to spread the setup cost of the production machines over a large number of items; also permits the use of the same production equipment for different products. Also, it can provide for savings on ordering costs, quantity discounts & transportation costs.
Cycle inventory – inventory resulting from the purchase or production of materials in lots.
3. To cover anticipated changes in demand & supply. Expected price changes, planned market promotion & seasonal businesses.
4. To provide for transit. (Pipeline inventory – inventory in transit)
Inventory Cost Structures
1. Item Cost – the cost of buying or producing the individual inventory item.
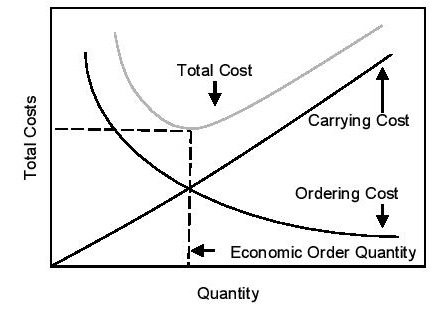
2. Ordering (or setup) Cost – associated with ordering a batch or a lot of items.
• It does not depend on the number of items ordered but rather assigned to the entire batch
3. Carrying (or holding) Cost – associated with keeping items in inventory for a period of time.
Three Components:
a. Cost of Capital – the cost of foregone opportunities for other investments.
b. Cost of Storage – a variable with inventory levels; includes variable space costs, can be insurance & taxes
c. Costs of Obsolescence, Deterioration & Loss –pilferage and breakage costs.
4. Stockout Costs – reflect the economic consequences of running out of stock.
Independent versus Dependent Demand
Independent Demand – influenced by market conditions outside the control of operations [“independent of operations”]; like finished goods inventory & spare parts inventory • Customer-oriented; order point system
Replenishment Philosophy. As the stock is used, it is replenished in order to have materials on-hand for customers. Thus, as inventory begins to run-out, an order is triggered for more material & the inventory is replenished.
Dependent Demand – related for the demand of other items & is not independently determined by the market; exhibits on-again, off-again pattern when production is scheduled in lots; like raw materials & work in process inventories.
• Manufacturing-oriented, MRP
Requirements Philosophy. The amount of stock ordered is based on requirements for higher-level items. More material is ordered only as required by the need for other higher-level or end items.
Total Cost = Ordering Costs + Carrying Costs
• Ordering & carrying costs are offsetting; one increases while the other decreases
Handling Random Demands:
Stock Position (or Available Stock) = On-hand + On-order material
A. Fixed-Order Quantity System Decision Rule (Q System): Continually review the stock position, when it drops to the reorder point, R a fixed quantity, Q is ordered.
Reorder Point = Mean demand over the lead time + safety stock
B. Fixed-Order Point System Decision Rule (P System): Review the stock position at fixed periodic intervals, P. An amount equal to target inventory, T minus the stock position is ordered at each review.
Service Level – the percentage of customer demands satisfied from inventories.
ABC Inventory Concept – based on the “significant few & insignificant many”; or the 80-20 rule.
Facilities & Aggregate Planning
Capacity – maximum output that can be produced over a given period.
Nominal or Effective Capacity – obtained by subtracting downtime for maintenance, shift breaks & equipment utilization that decreases the theoretical capacity available
• The maximum amount that can be used when planning for actual facility output over some period of time.
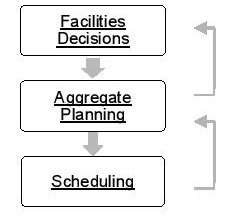
Facilities Decisions – place physical constraints on the amount that can be produced, & they require investment of scarce capital; involve all organizational functions & are often made at the highest corporate level
Important Considerations: Predicted demand, cost of facilities, likely behavior of competitors, business strategy & international considerations
Elements of Facilities Strategy
A. Amount of Capacity.
Capacity Cushion = Capacity – Average Demand
Positive: for expanding market, cost of building & overcapacity > cost of running out of capacity
Zero – Negative: goal of maximizing utilization, capacity is very expensive, for capital-intensive industries
B. Size of Units/Facilities.
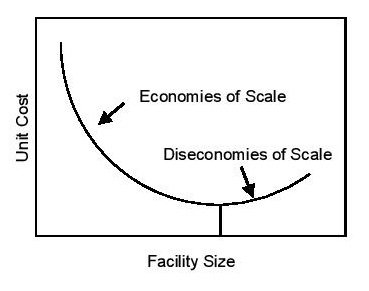
Economies of Scale. Based on the notion that large units are more economical because fixed costs can be spread over more units of production.
Diseconomies of Scale. Facilities get larger for several reasons – communications, coordination and control costs increase in large bureaucratic organizations; cost of complexity and confusion.
C. Timing of Facility Additions. There are basically two opposite strategies:
(1) Preempt the competition or (2) Wait and see will work best if the follower has superior marketing channels or technology.
D. Type of Facilities. Four types of facility choices:
1. Product-focused – produce one family or type of product, usually for a large market; used when scale economies are high, transportation costs are low.
2. Market-focused – located in the markets they serve; beneficial when there are tariffs, trade barriers & potential currency fluctuations, & high transportation costs; for those that require quick customer response or customized products.
3. Process-focused – have one technology or at most two; for subassembly plants.
4. General-purpose – may produce several types of products & use several different processes.
II. Aggregate Planning – matching supply & demand for output over the medium time range (6-12months). Planning is done for a single overall measure of output or, at the most, a few aggregated product categories.
• The aim is to set the overall output level in the near to medium future in the face of fluctuating or uncertain demand.
• Demand can be influenced by pricing – differential pricing; advertising & promotion; backlog (asking customers to wait for their orders) or reservations (reserving capacity in advance; development of complementary products – in seasonal demands, firms develop counter-cyclic seasonal trends.
• Supply can be influenced by: hiring and layoff of employees; overtime & undertime; part-time or temporary labor; carrying inventory; subcontracting; making cooperative arrangements.
• Basic Strategies:
1. Level Strategy – level the workforce; for high-skilled labor & complex jobs
2. Chase Strategy – chase demand with the workforce; for low-skilled labor & routine jobs
Material Requirements Planning
Master schedule – specifies the end items or output of the production function; contains specific product configurations or final assembly part numbers.
• Using MRP, the master schedule is exploded (through the BOM) into purchase orders for raw materials & shop orders for scheduling the factory.
Process Explosion – determine all parts & components needed to make a specified number of final product units
Three Principal Inputs: master schedule, BOM, & inventory records.
Two Principal Outputs: purchase orders & shop orders
• MRP is an information system used to plan & control the manufacturing function in terms of products, orders, parts, production levels & inventories.
• MRP uses a requirements philosophy – parts are ordered only as required by the master schedule. The MRP logic assumes that parts are available exactly when they are needed to support the production plan.
Three Principal Functions of MRP:
1. Inventory – order the right part in the right quantity at the right time
2. Priorities – order with the right due date, keep the due date valid.
3. Capacity –a complete load, an accurate (valid) load, an adequate time span for visibility of future load.
Different Types of MRP:
1. Type I: An inventory control system (order launching) – does not include the capacity planning & shop-floor control modules
2. Type II: A production & inventory control system; “closed-loop system”
3. Enterprise Resource Planning (ERP) System – companywide system used to plan & control all resources, including inventory, capacity, cash, personnel, facilities & capital.
• In manufacturing, it is common that companies build assemblies for inventory in order to reduce total production lead time & to save setup costs.
• Aggregate Production Plan deals with families of products/product lines, not specific products, models or option that are in the master schedule.
Bill of Materials (BOM) – is a structured list of all materials or parts needed to produce a particular finished product, assembly, subassembly, manufactured part or purchased part.
Ways of Handling Uncertainty on Operating an MRP System: safety stock, safety lead time, safety capacity
• For successful MRP system, there must be: (1) implementation planning; (2) adequate computer support; (3) accurate data; (4) management support; & (5) user knowledge
Just-In-Time Systems & Lean Thinking
• JIT is an approach that seeks to eliminate all sources of waste in production activities by providing the right part at the right place at the right time.
“Doing more with less and doing it well”
Seven Wastes: (1) Overproduction, (2) Waiting Time, (3) Transportation – double/triple movement of materials, (4) Processing – poor design or inadequate maintenance; (5) Inventory; (6) Motion – wasted movement; (7) Defects
• In addition, another major tenet in its philosophy is the utilization of the full capability of the worker.
Elements of JIT:
JIT uses a simple parts withdrawal system, called Kanban, to pull parts from one work center to the next. Parts are kept in small containers, & only a specific number of containers are provided. Work in process inventory is limited to available containers, & parts are only provided as needed. Suppliers also receive Kanban containers & are viewed as an extension of the plant.
The objective of JIT is to produce parts in a lot size of one. Lot size depends on the trade-off between carrying & setup costs. Production is leveled to create a uniform workload on all work centers that support the final assembly. Setup time is reduced as much as possible, ideally to zero [quick changeover].
Multi-function workers are required; cross-training is needed as well as greater coordination & teamwork. The layout of the plant is much different since inventory is held on the shop floor & not put in a storeroom between processes.
Quality is absolutely essential – not only do defects produce waste, but they can also grind the production process to a halt. o JIT system is designed to expose errors & get them corrected, rather than covering them up with inventory.
o With the JIT system, there is a tendency to use a few suppliers. This is done to establish a long-term relationship with the supplier to ensure the quality of parts needed. Supplier prices, however, can be kept in line with long-term contracts that include negotiated price stability.
The objective of JIT is to improve ROI by increases in revenues, cost reduction & less investment.
Problem-solving activities by management & workers drive the whole system – built on the philosophy of constant improvement.
Inventory is viewed as the root of all evil.
Kanban System – signal the need for more parts & to ensure that those parts are produced in time to support subsequent assembly.
Two Types of Cards: production cards & withdrawal (move) cards.
•
- Reducing setup times & lot sizes increase available capacity, increases flexibility to meet schedule changes, & reduces inventory.
- The low setup times can be achieved by (1) separating external setups – can be done while the machine is operating, from the internal setups – actions that require the machine to be stopped; (2) as much of the steps is converted from internal to external setups.
MRP vs. JIT (Internal Perspective)
MRP: Push system, pushes material into production to meet future needs
JIT: Pull system, the material is pulled through production by subsequent (using) work centers.
a. For pure repetitive manufacturing situations, use JIT or MRP Type I
b. For batch manufacturing, use a hybrid of MRP Type II & JIT
c. For job shop, batch-oriented, non-repetitive, use MRP; Kanban system will no work
Lean Thinking (External Perspective)
Elements: (1) Specify a value from the customers’ point of view; (2) Create a value stream map & remove waste; (3) Flow the product or service through the system; (4) Pull the product or service from the customer; (5) Strive for perfection.
Quality Management
Quality – meeting or exceeding customer requirements now & in the future
Continuous improvement – reducing the variability in all processes & introducing new products when needed.
Dimensions of Quality: 1. Quality of Design – determined by market research, design concept, & specifications
2. Quality of Conformance – producing a product that meet the specifications
3. Availability – continuity of service to the customer
4. Reliability – length of time a product can be used before it fails
5. Maintainability – restoration of a product or service once it has failed
6. Field Service – warranty & repair or replacement of the product after it has been sold.
Service Quality (SERVQUAL – as a popular measure)
Five Perceptual Measures: 1. Tangibles – appearance of the company’s physical facilities, equipment, & personnel
2. Reliability – ability of the company to perform the promised service dependably & accurately without errors
3. Responsiveness – willingness of the company to provide service that is prompt & helpful to the customer
4. Assurance – knowledge & courtesy of the employees & their ability o convey trust & confidence
5. Empathy – caring, individualized attention provided to customers
Planning for Quality: Quality attributes -> Measure Quality -> Standards -> Testing Program -> Find & correct causes of poor quality -> Continuous improvement
Poka-yoke – “mistake proofing” – to design a product & process so it is impossible to make mistakes or if the error cannot be prevented from occurring, it should be made easy to detect; example: microwave (won’t start if the door is open)
ISO9000 Standards – specifies that a company must have a quality system in place, including procedures, policies & training to provide quality that consistently meets customer requirements.
• The product itself is not certified as having high quality; only the process for making the product is certified.
• It does not provide a complete quality system because it does not address competitive strategy, information systems and business results.
Malcolm Baldrige Award – Total Quality System – given to at most two companies in each of the categories: manufacturing, service & small business extended to education & health care organizations.
Criteria: (1) Leadership; (2) Strategic Planning; (3) Customer & Market Focus; (4) Measurement, Analysis & Knowledge Management; (5) Human Resource Focus; (6) Process Management; & (7) Business Results.
Quality & Financial Performance
• By assigning a cost to poor quality (cost of quality), it can be managed & controlled like any other costs.
Components of the Cost of Quality: 1. Control Costs – related to activities that remove defects in the production stream: (a) prevention costs; (b) by appraisal or by inspection
2. Failure Costs – incurred either during the production process (internal) or after the product is shipped (external).
Continuous Improvement – to reduce variability of products or processes; use tools like Pareto Analysis, Cause & Effect Diagrams
• The tools by themselves will not lead to continuous improvement; they need to be incorporated into an improvement approach such as Six Sigma
Six Sigma – systematic method for process improvement that often uses the following steps:
1. Define. The process is selected for improvement & the project charter is specified.
2. Measure. Quality variables valued by the customer are measured & goals are set for improvement
3. Analyze. The root causes of the current defect levels are identified & alternatives are considered for process changes.
4. Improve. The process is changed & checked for improvement.
5. Control. The step ensures that the process improvement is not lost over time
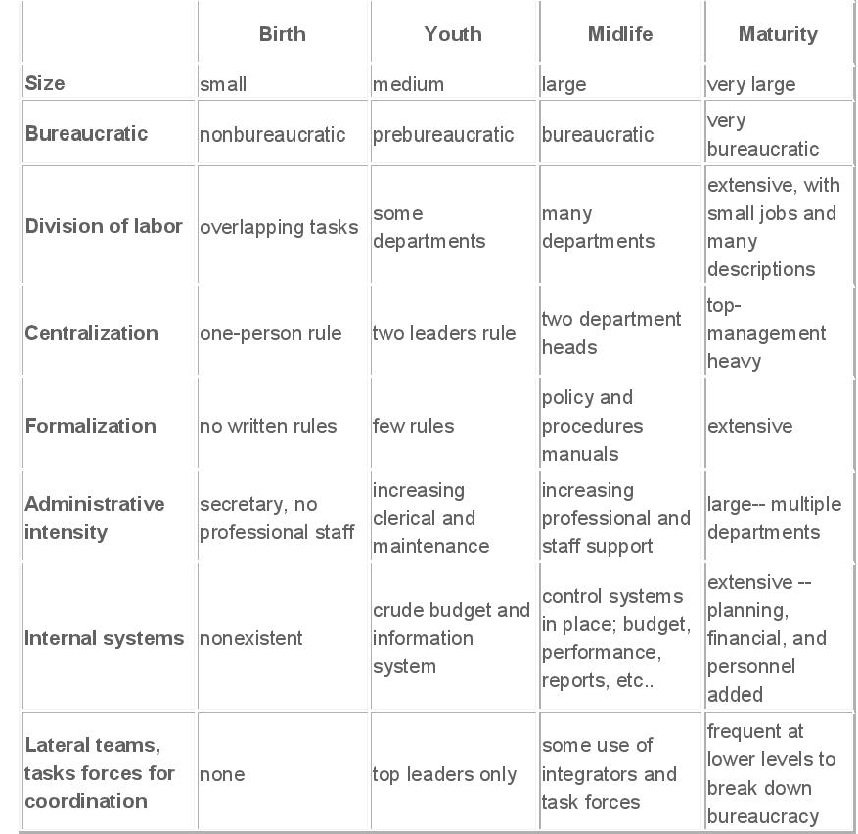
BUSINESS LIFE CYCLE


